| | | The tape finally blinked. Translation: key indices finally broke their recent ranges. After testing new highs near 7,000 in late January, the S&P 500 hit its lowest level since November. Oil spiked. Yields jumped. Gold surged. This isn't just a passing shift in sentiment. It is a set of limits every operator and allocator has to respect. | Here is the situation. The Iran conflict and the Strait of Hormuz are dictating terms across asset classes. Markets are also watching whether Washington taps strategic reserves. Volatility is acting exactly as it does when an energy shock meets policy uncertainty. It climbs, and the market plumbing bends. We will keep this straightforward—no doom, no sugarcoating. Just the signals that matter and the calendar that forces hands. | |
| | |
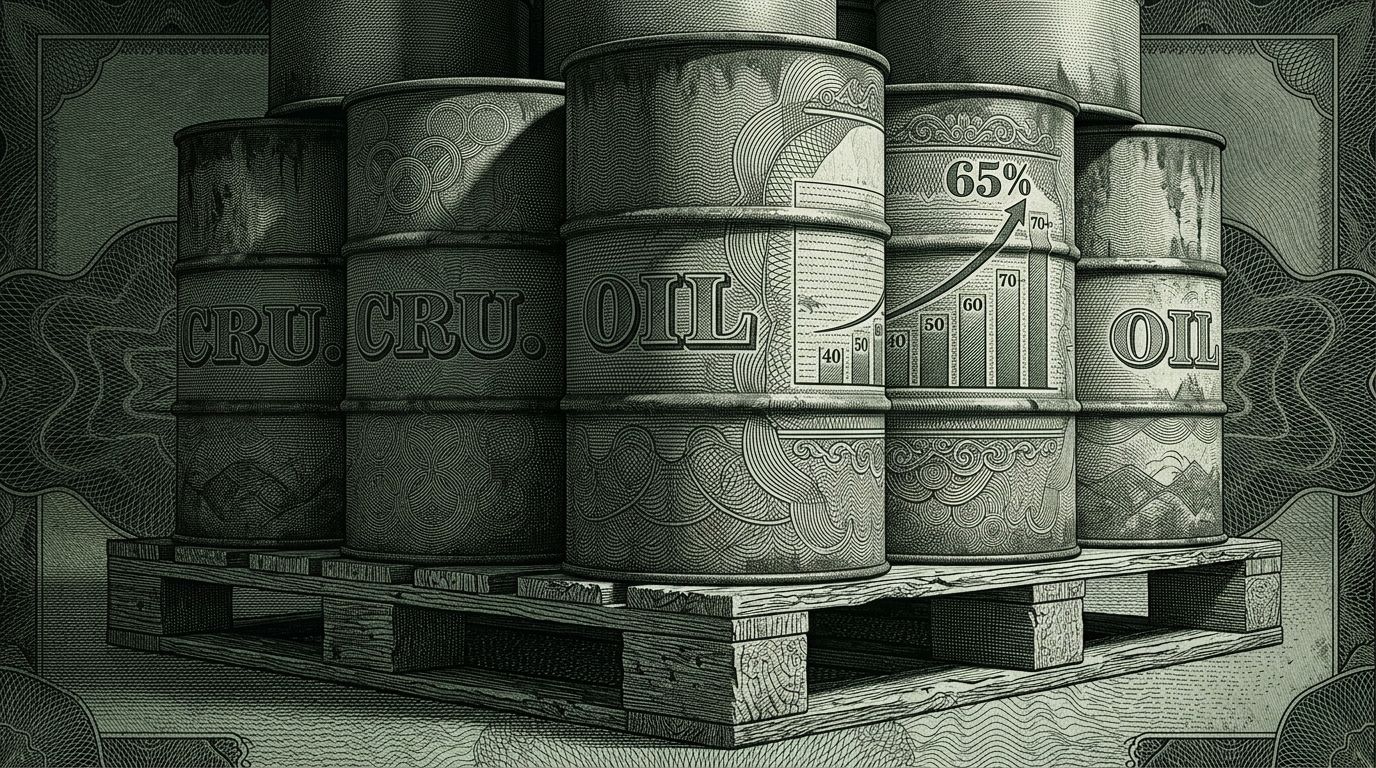
| | | Broad Market Selloff Intensifies Investor Anxiety | The market's pullback intensified this week. The S&P 500 tagged a record near 7,000 in late January. It now sits less than 5% below that peak. The trajectory is what concerns investors. Data indicates we are at the lowest levels since November. Small caps (the Russell 2000) are down more than 8%. That is the tape indicating that economically sensitive balance sheets feel the pressure first. | Energy is the accelerant. Oil is up around 40–50% year-to-date, jumping roughly 20–30% in just the first part of March alone. Add a sharp rise in the 10‑year Treasury yield since the Iran conflict began. Higher discount rates hit multiples, while energy squeezes margins. The White House isn't panicking yet on oil, but that stance could shift in weeks. Markets already price in a possible emergency Strategic Petroleum Reserve (SPR) release. | | Under the hood, gold remains robust, up roughly 20% year-to-date. That is the classic "insurance" bid. Tech continues to absorb capital. Oracle recently posted at least 20% growth in revenue and earnings, driven by AI demand. It remains a focal point alongside Nvidia, Microsoft, and Apple. Still, technicians flag choppy action. Key levels to watch on the S&P 500 include near-term hurdles at 6,845 and 6,907, with downside support markers at 6,717 and the 200‑day moving average near 6,591. | Executives see input costs, financing, and demand tighten simultaneously. Builders and investors see a tape that prices in uncertainty, not apocalypse. That gap shapes capital plans and go‑to‑market pacing. |
| | |
| | | Historical Panic Windows | A familiar historical signal is flashing. The S&P 500 recently closed below the December low of 6,720. When the index breaks December lows in the first quarter, history skews bearish. Historically, such breaks have often been followed by further downside, on the order of around 10%. There are no guarantees—just the tape's memory. | Volatility's term structure confirms this stress. The VIX is elevated, and the futures curve has recently swung into and out of backwardation—meaning there are periods when near-term fear is priced higher than longer-term expectations. This is not mere theory; it is how institutions hedge when event risk clusters. Combine this with the technical levels—6,845 on the upside and 6,591 as a 200‑day line in the sand—and a clear "panic window" emerges. | Panic windows compress decision cycles. Operators see customers delay purchase orders. CFOs revisit their cost of capital—the hurdle rate a project must clear to be profitable. Product teams rethink launch timing. The calendar, not just valuation, starts steering choices. | |
| | |
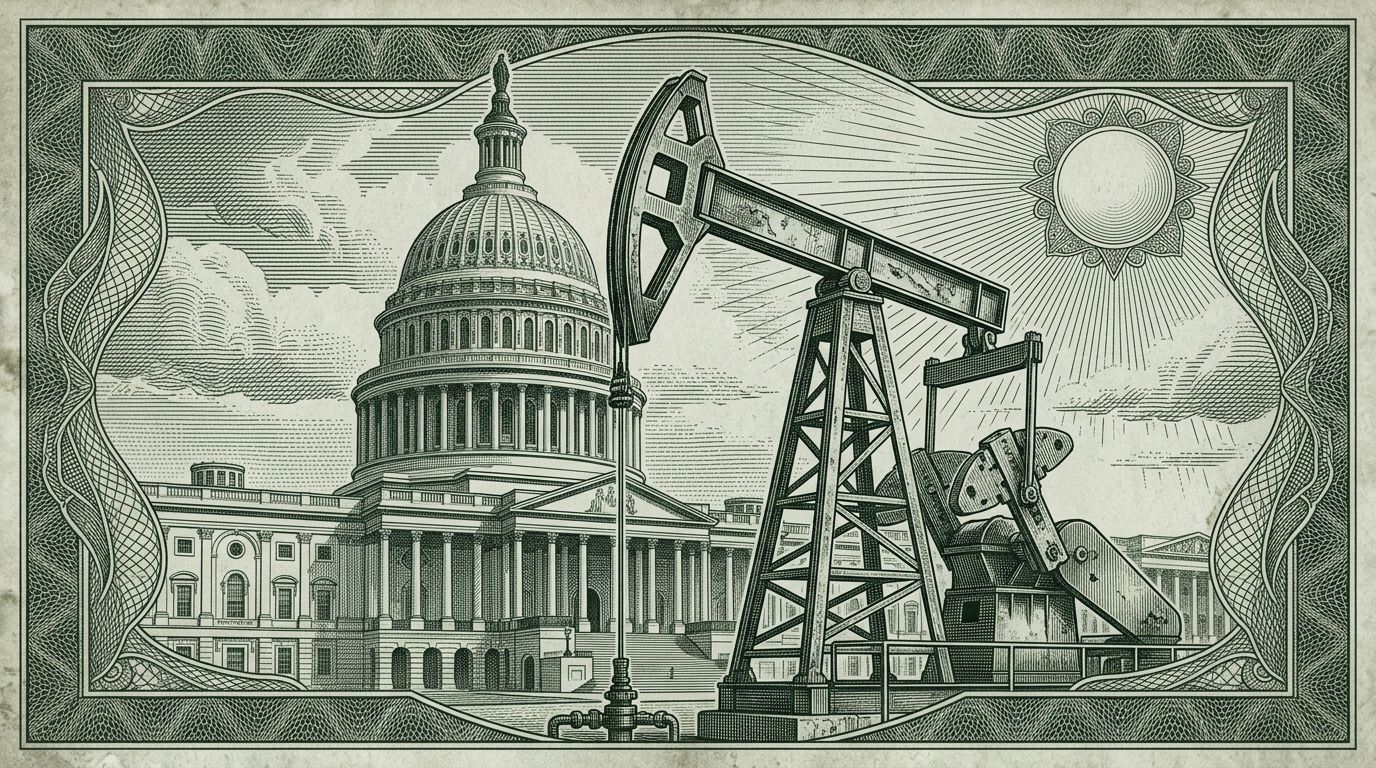
| | | Compounding Risks and Market Stress | Narratives don't move physical freight, but they do move investment flows. Right now, the conditions for a sustained market stress test are aligning. A geopolitical shock meets slowing growth, while inflation won't fully let go. | Start with real‑economy markers. Recent macroeconomic data points to a cooling economy, with late 2025 GDP growth appearing muted and early 2026 labor metrics showing signs of softening. Meanwhile, early-year CPI prints hovered in a manageable mid-2% range. However, that was before the oil surge. Energy accounts for a significant portion of CPI and spills into transport, packaging, and food. The next prints risk re‑acceleration even as growth softens. That is the core stagflation fear. | Add market‑structure stress. The VIX is in an uptrend and has recently flashed warning signs by temporarily flipping into backwardation. Volatility products and hedges get bid when the term structure flips. Market structure confirms a classic risk‑off barbell with gold advancing and oil climbing. Private markets aren't immune either. More private‑equity stress is surfacing as credit markets signal tighter lending criteria and liquidity begins to dry up in alternative assets. That is the credit channel at work. When funding lines crimp, portfolio companies feel it in hiring and capex. | Corporate signals are split, as is typical during transitions. Oracle's AI‑driven growth shows enterprise compute budgets still find capital for "must‑scale" workloads. At the same time, traditional consumer staples companies have been cutting outlooks. Consumers are trading down. The retail shelf is tougher. On the services side, business process outsourcing appears more exposed than specialized consulting. Translation: longer contracts and cost‑takeout work may hold up better than transactional outsourcing when CFOs shift to a defensive stance. | The "attention tape" backs this up. Top‑searched tickers skew toward AI and semiconductors, alongside mega-cap tech. These are the growth engines investors watch for capex and demand read‑throughs. Recent high-profile stock splits keep retail investors engaged. That dynamic can amplify swings around big headlines. | Finally, watch the policy‑and‑plumbing calendar. Chatter regarding an emergency oil release moves the "term premium"—the extra compensation investors demand for holding longer-term risk—regardless of whether a release immediately happens. Emerging market reclassifications on index provider calendars also pull forward flows as passive and active managers front‑run the mechanics. VIX futures for March expire on March 18. Earnings volatility looks elevated across key semiconductor and transport names mid-week. That is a significant cluster of catalysts. | Narratives set context, but constraints set choices. Run a P&L and you hear it. Inputs signal price volatility. Customers wince at budgets. Financing costs just ticked higher. Builders and investors share the same lens: price, policy, and plumbing. Those three dials decide what gets funded, shipped, and shelved. |
| | |
| | | The "Move Before Monday" Effect | Weekend risk focuses minds. Oil is up around 40–50% year‑to‑date, with a 20–30% burst in just the first part of March. Markets are weighing whether SPR chatter turns into action and how the Iran timeline evolves. That is the kind of uncertainty that pushes hedging and positioning before a Monday open. Add a VIX curve that has already tested backwardation earlier this month. Add March VIX futures expiring on March 18. Layer in a mid‑week earnings slate. You get calendar pressure to place exposures before liquidity thins. | There is another trap: endpoint bias—the tendency to judge a long-term strategy solely by its most recent performance trough. A simple 12‑month shift in an end date can flip performance leadership entirely in retirement portfolios. Markets will project a "now or never" urgency ahead of weekends and catalysts. Sometimes that is justified. Sometimes, it is merely tape‑driven momentum. | Periods like the next 72 hours tend to test discipline more than forecasting skills.The three dials that matter in uncertain weeks remain constant—price (energy, rates), policy (SPR signals, index calendars), and plumbing (volatility term structure, liquidity around expirations). Historically, experienced investors find that staying aligned, keeping assumptions current, and maintaining a clear strategy is the most reliable way to navigate the noise and protect capital. | |
| | |
|
|


No comments:
Post a Comment